eCommerce Dashboard: A Portal to Track, Analyze & Grow Your Store
Quick Summary
What It Is: A centralized hub tracking sales, marketing, customer behavior & inventory in real time, replacing messy spreadsheets with actionable visuals.
When running an online store, you need a portal from which to control every aspect of the website. A consolidated view of critical eCommerce metrics like sales, traffic, and customer behavior, into a single, actionable view. That’s where the eCommerce dashboard comes in.
Without it, decision-making becomes guesswork, buried under scattered spreadsheets and disjointed reports. Modern dashboards leverage real-time data visualization, so you can spot trends, optimize campaigns, and boost profitability.
This guide breaks down the must-have features, setup best practices, and more. Plus, you’ll see how the eCommerce experts streamline the operations effectively. Let’s begin.
What is an eCommerce Dashboard?
An eCommerce dashboard is a centralized analytics tool that tracks, visualizes, and interprets key performance metrics for online businesses. With it, you can monitor sales, traffic, conversion rates, inventory, and customer behavior in one place—often in real time.
Think of it as a command center. It highlights what’s working (best-selling products, high-converting campaigns) and what’s not (cart abandonment rates, stock shortages). Advanced dashboards integrate data from platforms like Shopify, Google Analytics, and Facebook Ads. That helps turn raw numbers into actionable insights.
For decision-makers, this means faster, data-backed strategies—whether optimizing ad spend, improving UX, or preventing stockouts. In short, an eCommerce dashboard isn’t just a reporting tool; it’s a profit driver.
Key Features of an eCommerce Dashboard
A powerful eCommerce dashboard goes beyond basic sales tracking—it provides real-time insights to optimize performance. Here are the essential features every business should look for:
(Here, we’ll take images from the Shopify dashboard for reference.)
Sales & Revenue Analytics
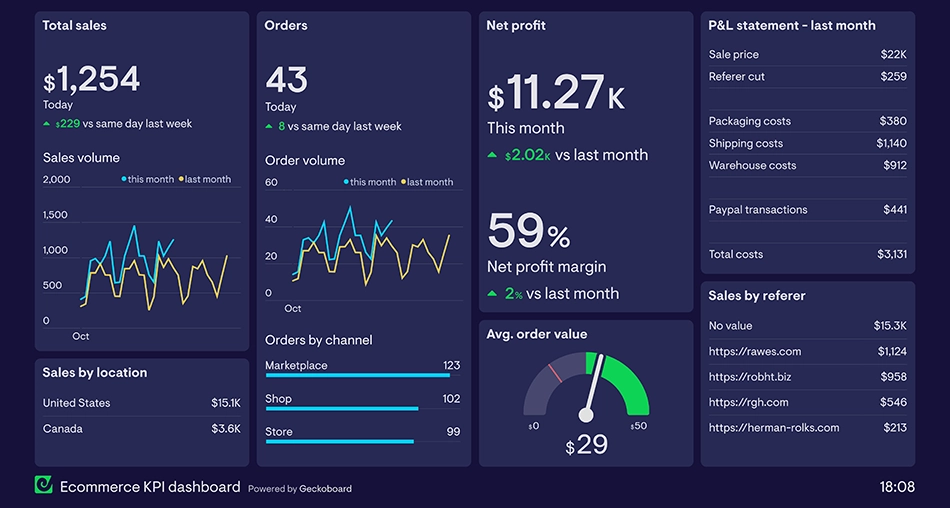
Your dashboard should transform raw sales data into actionable insights. eCommerce analytics can help track daily, weekly, or monthly revenue trends, average order value (AOV), and top-performing products. Spot seasonal spikes, identify underperforming SKUs, and adjust pricing strategies—all in real time.
A well-optimized sales dashboard doesn’t just report numbers; it reveals profit opportunities.
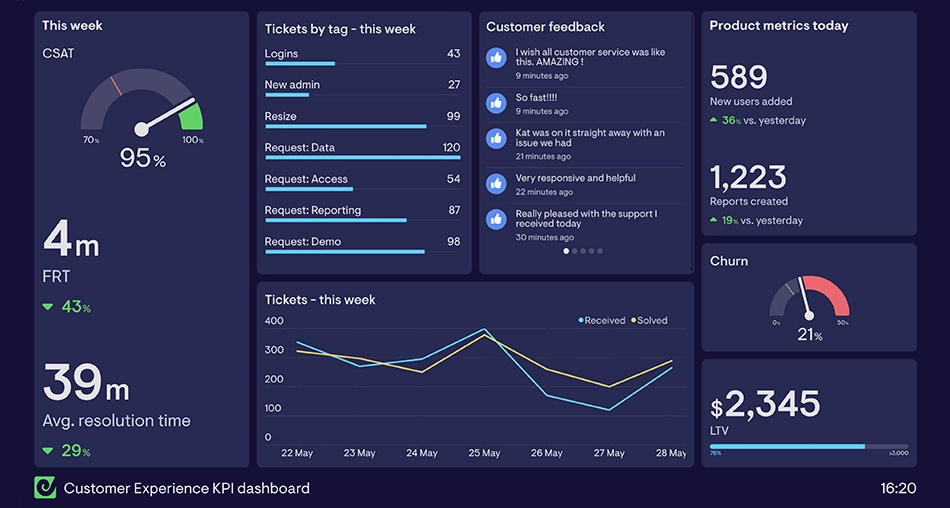
Customer Behavior Metrics
Understand what drives—or derails—conversions. Monitor metrics like bounce rates, session duration, and repeat purchase rates to gauge customer engagement. Heatmaps and funnel analysis can pinpoint where shoppers drop off, so you can refine UX and boost retention. Data-backed customer insights turn guesswork into growth.
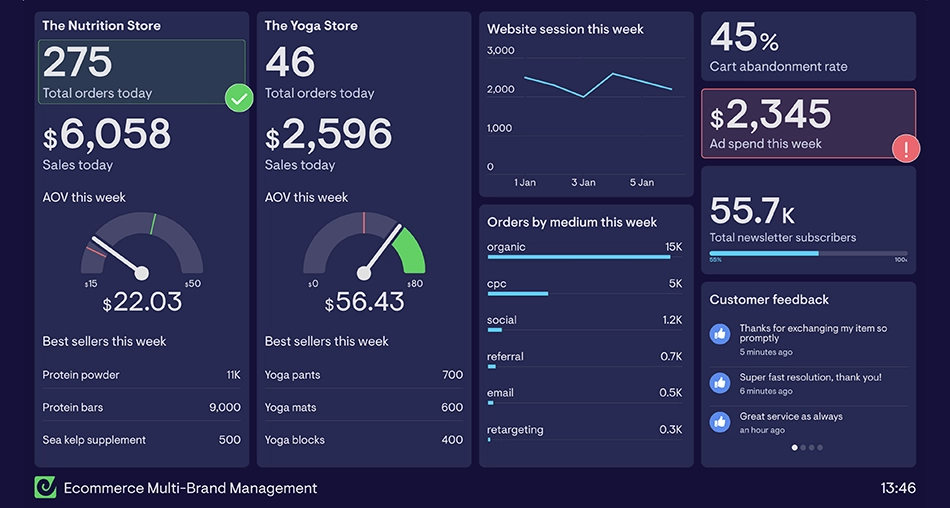
Traffic & Acquisition Sources
Not all visitors are equal. Break down traffic by source (organic, paid, social, email) to see which channels deliver the highest-value customers. Track cost-per-acquisition (CPA) alongside conversion rates to optimize ad spend. A clear view of traffic sources ensures you invest where it counts.
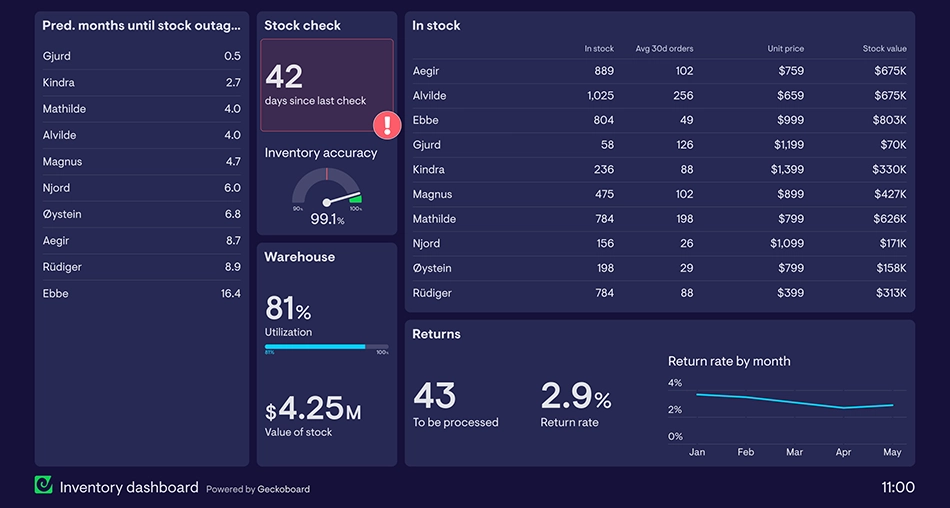
Inventory Management
Avoid stockouts and overstocking with inventory management and live tracking. Set low-stock alerts, analyze turnover rates, and forecast demand based on historical sales. An integrated inventory dashboard keeps supply chain hiccups from becoming lost sales.
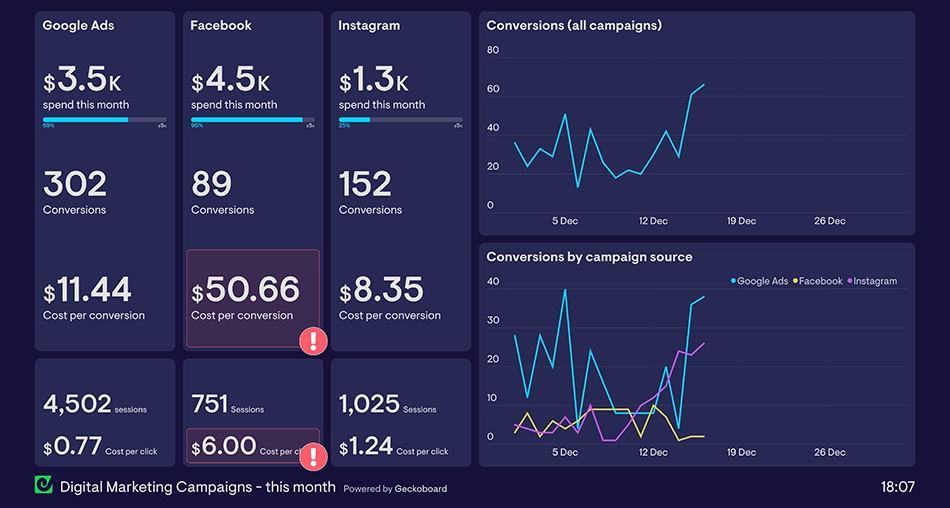
Marketing Performance
Which campaigns actually drive revenue? Measure ROI across email, social, and PPC campaigns with metrics like click-through rates (CTR), conversion attribution, and customer lifetime value (CLV). Cut underperforming ads and double down on what works—without wasting budget.
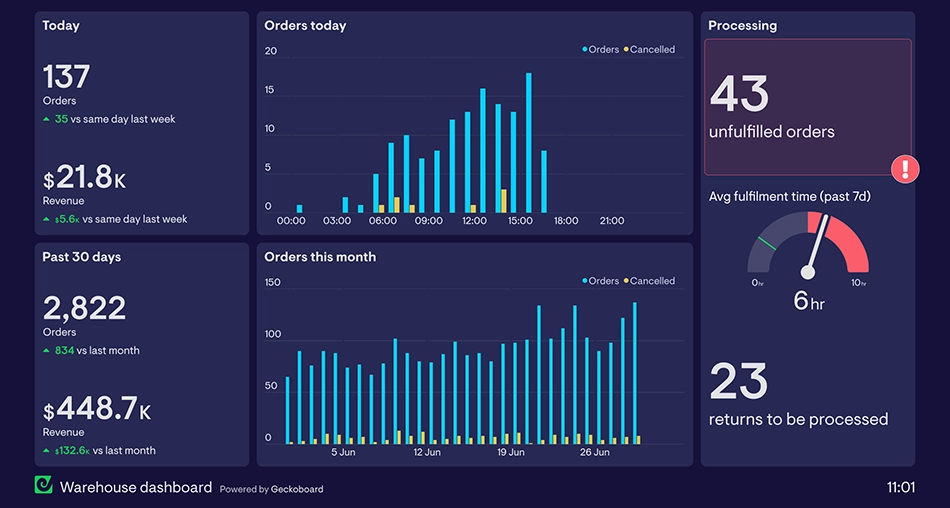
Order & Fulfillment Status
From checkout to delivery, track order statuses in real time. Identify bottlenecks in processing, shipping delays, or return rates that hurt customer satisfaction. Proactive eCommerce fulfillment and monitoring keeps operations smooth and customers happy.
Customizable Reports
No two businesses analyze data the same way. Tailor dashboards with drag-and-drop widgets, scheduled reports, and exportable data. Whether you need a high-level overview or granular deep dives, customization ensures you see what matters most—your way.
The best dashboards integrate with tools like Google Analytics, Shopify, and Meta Ads, turning raw data into actionable strategies.
Track smarter, sell better. Reach out to build your eCommerce dashboard.
Key Metrics Evaluated Through eCommerce Dashboards
The primary use of the dashboard is to evaluate the store. That is done through some crucial eCommerce metrics. Let’s look at them one by one.
Conversion Rate
Your store’s conversion rate is the heartbeat of your business—it reveals what percentage of visitors actually make a purchase. A low rate could indicate UX issues, unclear pricing, or poor product positioning.
Track it daily to spot trends and test optimizations like checkout simplifications or better CTAs. Even a 1% boost can mean massive revenue gains at scale.
Formula
Conversion Rate = (Number of Conversions / Total Number of Visitors) x 100
Bounce Rate
High bounce rates? Visitors are leaving without engaging, often due to slow load times, irrelevant traffic, or weak landing pages. Analyze this metric by traffic source to identify leaks in your funnel—then fix them.
A well-optimized page keeps shoppers exploring instead of exiting.
Formula
Bounce Rate = (Single-Page Visits / Total Website Visits) x 100
Click-through Rate (CTR)
CTR measures how compelling your ads, emails, or product listings really are. Low CTRs mean your messaging isn’t resonating. Test headlines, visuals, and placements to grab attention—because if users don’t click, they can’t convert.
Formula
CTR = (Number of Clicks / Number of Impressions) x 100
Clicks: This refers to the total number of times users clicked on your ad, email link, or website link.
Impressions: This represents the total number of times your ad, email, or link was displayed.
Average Order Value (AOV)
AOV tells you how much customers spend per transaction. Increase it with strategic upsells, bundles, or free shipping thresholds. A higher AOV means more revenue without necessarily needing more traffic—profitability unlocked.
Formula
AOV = Total Revenue / Number of Orders
Cost Per Acquisition (CPA)
CPA reveals how much you’re spending to gain a single customer. Compare it to CLV to ensure profitability. If your CPA is too high, refine targeting, improve ad creatives, or optimize landing pages to attract higher-value buyers at lower costs.
Formula
CPA = (Total Cost of Customer Acquisition) / (Number of New Customers Acquired)
Cart Abandonment Rate
Cart abandonment is a silent revenue killer. If shoppers add items but don’t complete purchases, your checkout process may be too complicated. Tactics like exit-intent popups, guest checkout options, or abandoned cart emails can recover lost sales.
CLV predicts how much a customer will spend over their entire relationship with your brand. High CLV means strong loyalty; low CLV signals a need for better retention strategies. Focus on repeat purchases—it’s cheaper to keep customers than to acquire new ones.
Formula
CLV = Average Order Value (AOV) x Purchase Frequency x Average Customer Lifespan
Purchase Frequency: This is the average number of times a customer makes a purchase within a specific timeframe (e.g., per year).
Average Customer Lifespan: This is the average duration of a customer’s relationship with your brand.
Return on Ad Spend (ROAS)
ROAS in eCommerce measures how much revenue your ads generate for every dollar spent. A ROAS of 3:1 means $3 earned per $1 spent. Track it by campaign to identify top performers and cut wasteful spending. Profitability starts with a good ROI.
Formula
ROAS = Revenue from Ad Spend / Cost of Ad Spend
Customer Retention Rate
Remember that repeat customers spend more and cost less to maintain. A high retention rate means your brand delivers value beyond the first purchase. Use loyalty programs, personalized offers, and stellar service to keep buyers coming back.
Formula
CRR = (Number of Returning Customers / Total Number of Customers) x 100
If you need help with analyzing any of these metrics, hire our professional eCommerce development company. We can customize the store dashboard for analysis according to the project.
Benefits of eCommerce Dashboard
While you may have understood the features and metrics offered by the dashboard, let’s discuss the benefits in detail.
Real-Time Decision Making
No more waiting for weekly reports—eCommerce dashboards provide live data on sales, traffic, and inventory. Spot trends as they happen and pivot strategies instantly, whether adjusting ad spend or restocking bestsellers before they sell out.
Centralized Data, Zero Guesswork
Ditch the spreadsheet chaos. A dashboard pulls metrics from multiple sources (Shopify, Google Ads, email campaigns) into one visual interface, eliminating manual data stitching and ensuring accuracy.
Identify Profit Leaks
Pinpoint underperforming products, high cart abandonment, or costly ad campaigns at a glance. Fix issues before they drain revenue—like optimizing checkout flows or pausing low-ROAS ads.
Boost Marketing ROI
Track campaign performance across channels in real time. Double down on what works (e.g., high-converting Instagram ads) and cut waste, ensuring every dollar drives maximum return.
Enhanced Customer Insights
Understand buyer behavior—repeat purchase rates, peak shopping times, preferred products—to personalize marketing and improve retention. Data beats assumptions every time.
Scalable Operations
As sales grow, manual tracking becomes impossible. Dashboards automate reporting, saving hours of labor and reducing human error, so you can scale without chaos.
Proactive Inventory Management
Avoid stockouts or dead stock with alerts and demand forecasts. Sync inventory levels with sales trends to optimize cash flow and storage costs.
Competitive Edge
Data-driven brands outpace competitors. With sharper insights, you can adapt faster—launching timely promotions, refining UX, or expanding into high-potential markets.
An eCommerce dashboard isn’t just a tool; it’s your business’s nervous system—turning raw data into profit, efficiency, and growth. For that, you may opt to hire Ecommerce experts.
FAQs on eCommerce Dashboard
Q1. How often should I check my dashboard?
Daily for real-time metrics (sales, ad performance) and weekly for trend analysis (customer retention, inventory). Set up alerts for critical changes, like stock shortages or traffic drops.
Q2. What’s the difference between a dashboard and an analytics tool?
Analytics tools (like Google Analytics) collect raw data; dashboards organize and visualize that data in an actionable way. Think of analytics as the engine and the dashboard as the speedometer.
Q3. Can I access my eCommerce dashboard on mobile?
Most modern dashboard tools offer mobile apps or responsive web interfaces, letting you monitor key metrics anytime, anywhere. This is especially useful for store owners who need real-time updates while on the go.
Q4. How long does it take to set up a dashboard?
Simple integrations (connecting Shopify + Google Analytics) can take under an hour. Complex setups with custom metrics may require days. Many providers offer templates to accelerate the process.
Q5. Can dashboards track competitor pricing?
Some specialized tools integrate competitor price monitoring, allowing you to receive alerts when rivals change prices. You can also analyze market positioning and automate repricing strategies.
Let’s Summarize
An eCommerce dashboard isn’t just another analytics tool—it’s the backbone of a data-driven business. It consolidates sales, marketing, customer, and operational insights into a single, intuitive interface. That helps transform raw numbers into actionable strategies.
With it, you can optimize ad spend, prevent stockouts, or improve customer retention. A well-designed dashboard gives you the clarity and speed needed to stay competitive. The right metrics, tracked in real time, can mean the difference between guessing and growing.
So, want help with your eCommerce business? Then connect with us today!
Maulik is an acclaimed E-commerce Business Consultant with comprehensive, all-around experience. He specializes in assisting businesses with critical decision-making that optimizes their operations, drives growth, and ultimately enhances the experience for their end customers. Maulik is the guide businesses turn to for clear strategic direction in the complex e-commerce landscape.
At BrainSpate, we recognize the power of standing out from the crowd in an effort to get more customers and product admirers. For that, you can have a consultation with us and get a free quote.